


Data analytics is the practice of turning raw data into decisions a business can act on — collecting and cleaning data, building pipelines and dashboards, and surfacing insights that drive action. For a company, it's a capability and a service, not a course or certification. The point isn't a chart; it's a decision with an owner.
That distinction matters. Most "data analytics" content online is about jobs, certificates, and salaries. This guide is the other thing: what data analytics means for a business, how the pieces fit together, and what it costs to build.
What is data analytics for a business?
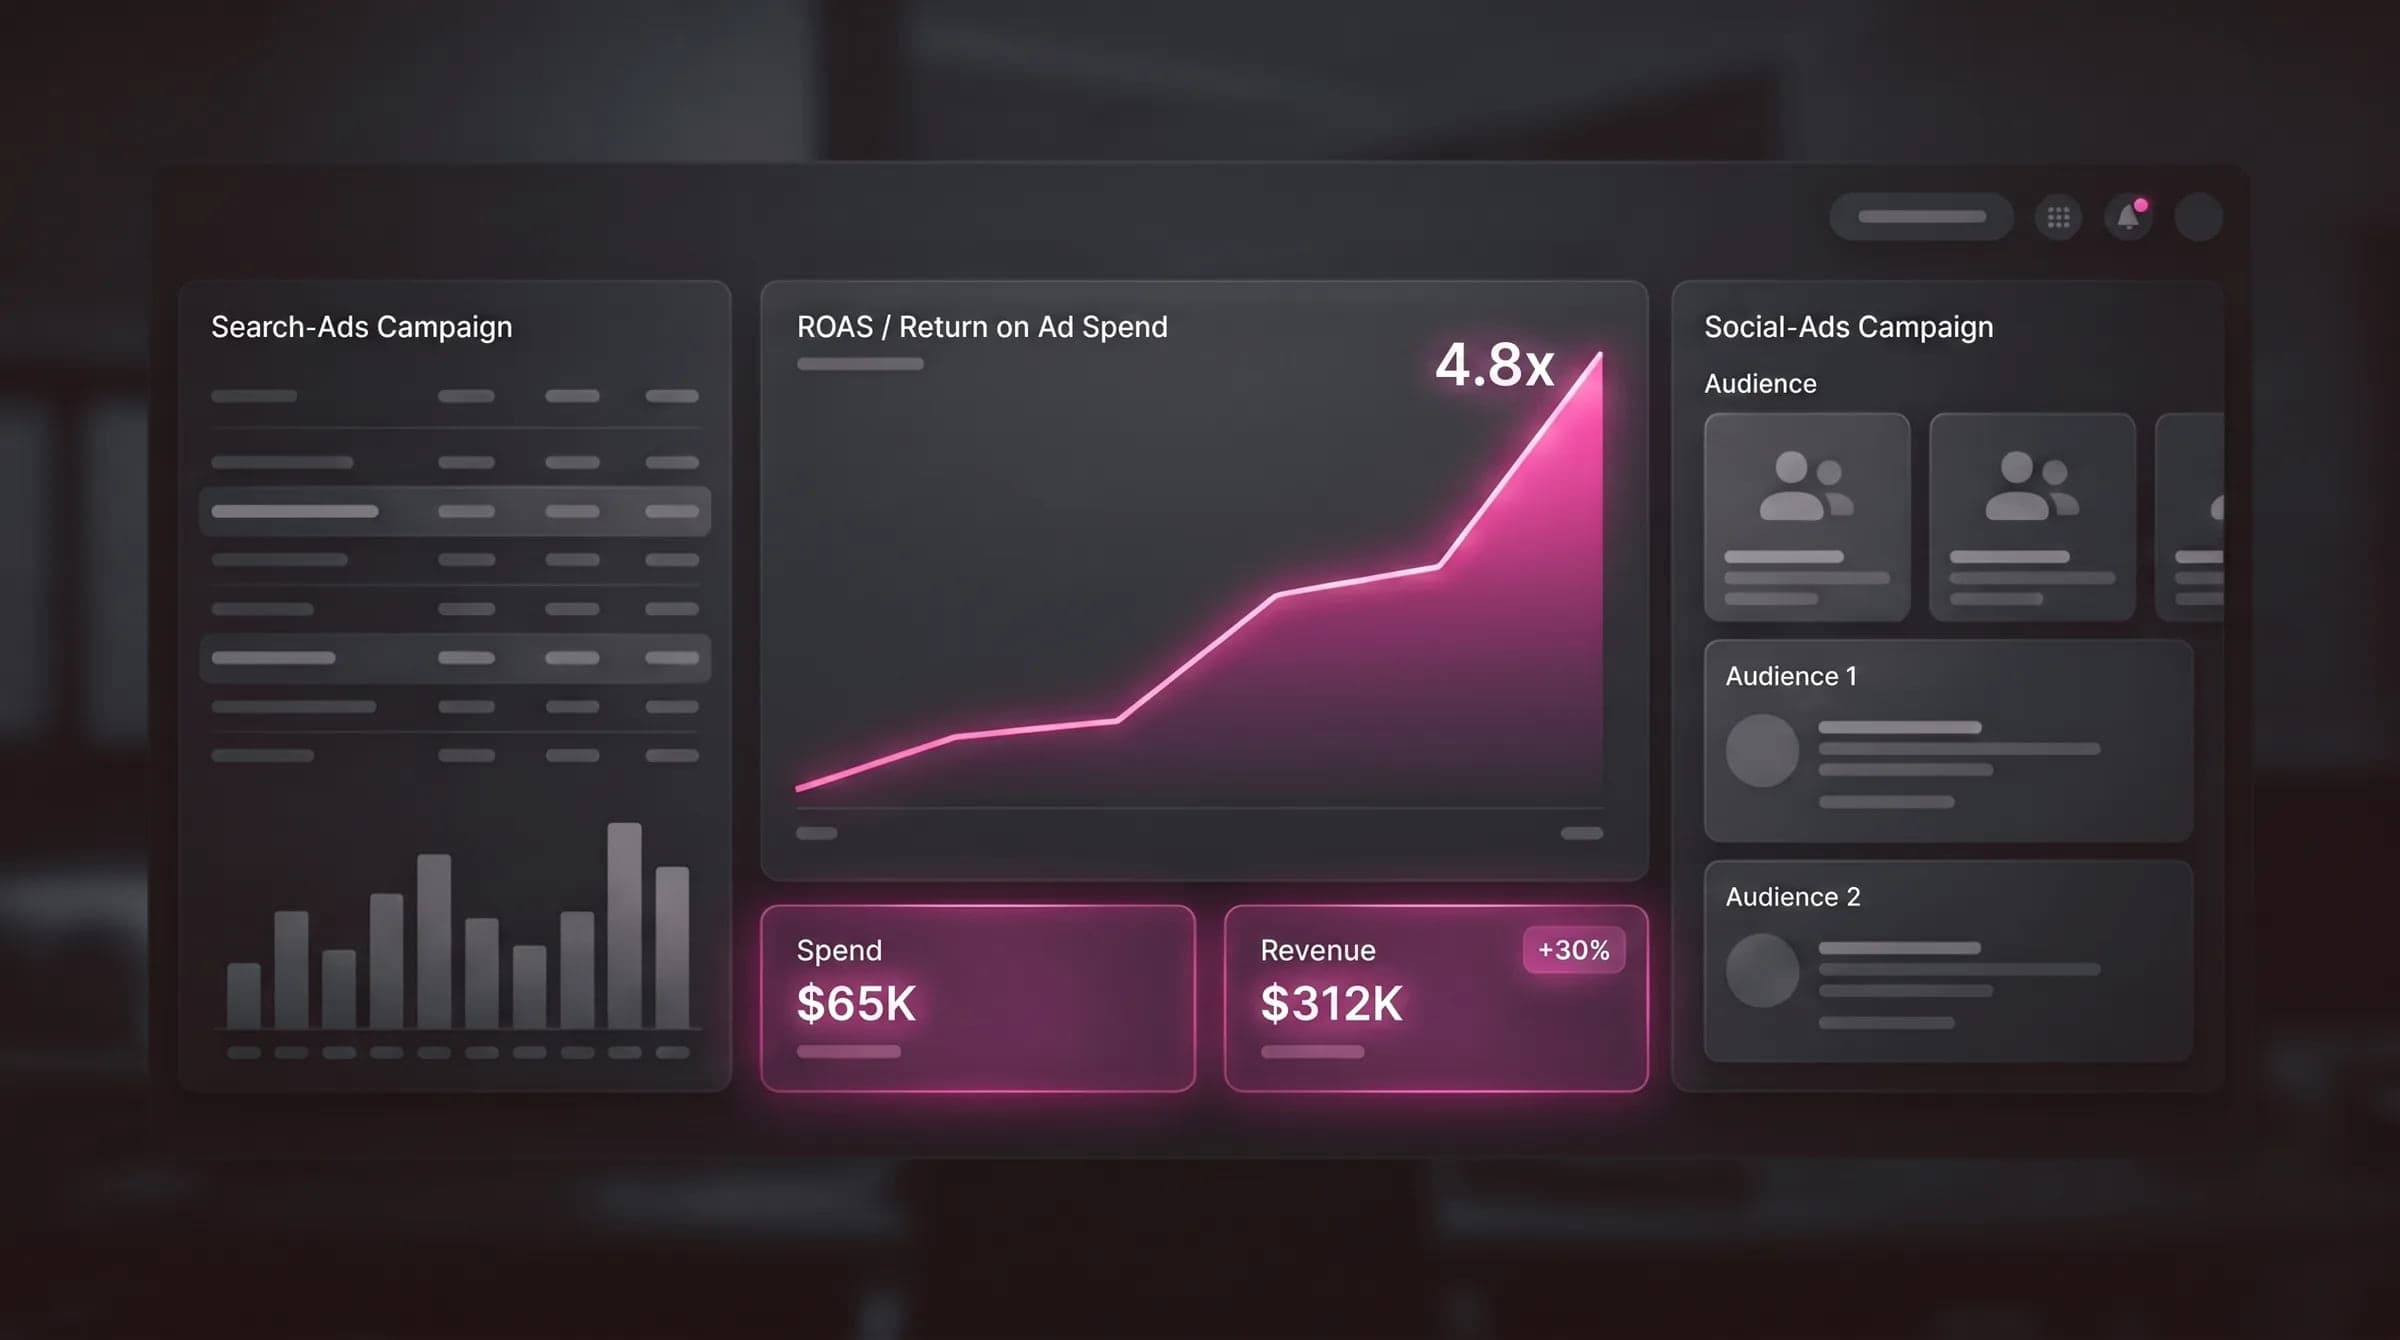
For an operator, data analytics is the work of getting from scattered, messy data to a number someone can act on. It spans the full stack: data engineering (pipelines and a warehouse), business intelligence (dashboards and KPIs), analytics and insights (the why behind the numbers), and increasingly predictive and AI analytics (what happens next).
The opposite of analytics isn't "no data" — most companies are drowning in it. The opposite is data you can't decide with: trapped in silos, never cleaned, or buried in a dashboard nobody opens.
Data analytics vs business intelligence vs data science
These three get used interchangeably, but they sit at different rungs of the same ladder — each builds on the one below it:
Business intelligence
- Answers what happened
- Example: a revenue dashboard by region
- Maturity: foundational
Data analytics
- Answers why it happened
- Example: churn traced to one onboarding step
- Maturity: core
Data science
- Answers what happens next
- Example: a model forecasting next-quarter demand
- Maturity: advanced
You don't skip rungs. A predictive model on top of messy, ungoverned data predicts garbage. The order — engineering, then BI, then analytics, then AI — is the order that actually ships value.
Data engineering vs data analytics
Data engineering is the plumbing: pipelines that move data, a warehouse that stores it, and the cleaning that makes it trustworthy. Data analytics is what sits on top — the dashboards, insights, and decisions. One team owning both ends is what keeps analytics from running on broken data, which is where most projects quietly fail.
Why analytics projects fail
The expensive failure mode isn't technical — it's a dashboard nobody uses. A report with no decision attached, no owner, and no action is just a prettier spreadsheet. The other failure is the data swamp: pipelines that break silently and ungoverned sources nobody trusts.
The fix is to design backward from the decision: name the metric, the action it triggers, and the person who owns it — then build the pipeline and the dashboard to serve that decision. Decisions, not dashboards.
How much do data analytics services cost?
There's no single sticker price, because the work scales with your data. The main cost drivers:
- Data volume and sources — three clean systems is a different project than twenty messy ones.
- Data quality — the more cleanup and governance needed, the more upfront engineering.
- Scope — a focused BI dashboard costs far less than a full warehouse-plus- pipeline build.
- Predictive / AI — forecasting, anomaly detection, and NL insights add data-science effort on top.
This is where a senior nearshore team changes the math. A partner in Mexico — same time zone as the US, bilingual, leaner than a Big-4 engagement — delivers warehouse, pipelines, and dashboards at senior quality below US onshore rates. The shared hours cut the slow feedback loops that inflate analytics budgets, lowering the total cost of delivery, not just the hourly number.
Two ways to buy data analytics services map to two needs: a fixed-scope project (a dashboard suite or warehouse build) or data analytics consulting and a managed retainer that maintains and evolves the stack over time. The first proves value fast; the second fits data that keeps changing.
Where WeEvolveIT fits
As a full-stack data analytics company, our practice runs the whole maturity ladder with one team: data engineering, business intelligence dashboards, analytics and insights, and predictive / AI analytics. Built on a modern stack (Snowflake, BigQuery, dbt, Power BI, Tableau, Python), with senior engineers in Monterrey on US business hours — and you own your data and stack: your warehouse, your code, your dashboards. No black-box lock-in. That mix — a nearshore wedge against India and Dubai shops, flat-fee scoping, and AI-first delivery — is what separates the data analytics companies that ship decisions from the ones that ship dashboards.
The bottom line
Data analytics, for a business, is turning raw data into decisions — not charts, not courses. Build it in order (engineering → BI → analytics → AI), design every piece backward from the decision it serves, and the dashboards get used. The cost scales with your data and scope, but a senior nearshore team usually gets you there for less total spend than an onshore build. The win isn't more data; it's the decision you can finally make with it.